Monitoring estuaries in a changing world: Lessons for designing long-term monitoring programmes
This guidance outlines key lessons for managers to consider when designing long-term monitoring programmes for estuaries (July 2021)
The 7 lessons in this guidance were learned from the Manukau Marine Ecology Monitoring Programme, one of the longest, ongoing estuary monitoring programmes in Aotearoa New Zealand, and informed by research from our Tipping Points project.
Long-term marine monitoring programmes are one of the only ways that we can:
- Define the state of the environment
- Understand the causes and magnitude of natural variability
- Provide baseline information so environmental changes related to management decisions can be detected
- Identify changes driven by manageable, human-driven stressors
- Show and track key trends to inform future management strategies
Introduction
Estuaries are at the interface of land and sea and subject to many human uses and impacts. Their inherent complexity requires robust monitoring and focused management attention.
In August 2020, the Parliamentary Commissioner for the Environment (PCE) released Managing our estuaries, a report that calls for national standardised approaches to managing estuaries. The PCE recommended establishing a “robust monitoring system to help local government and communities make informed decisions”.
State of the environment (SOE) monitoring provides local government and communities with information on what is happening in the environment.
The importance of long-term data in SOE monitoring has increased with our knowledge that climate change is occurring and that sudden, abrupt changes (tipping points) are likely consequences of multiple stressors and/or cumulative effects. Long time-series are one of the only ways that we can show key trends, understand the magnitude of natural variability, and separate changes driven by manageable, anthropogenic drivers from climate change.
About the Manukau Marine Ecology Monitoring Programme
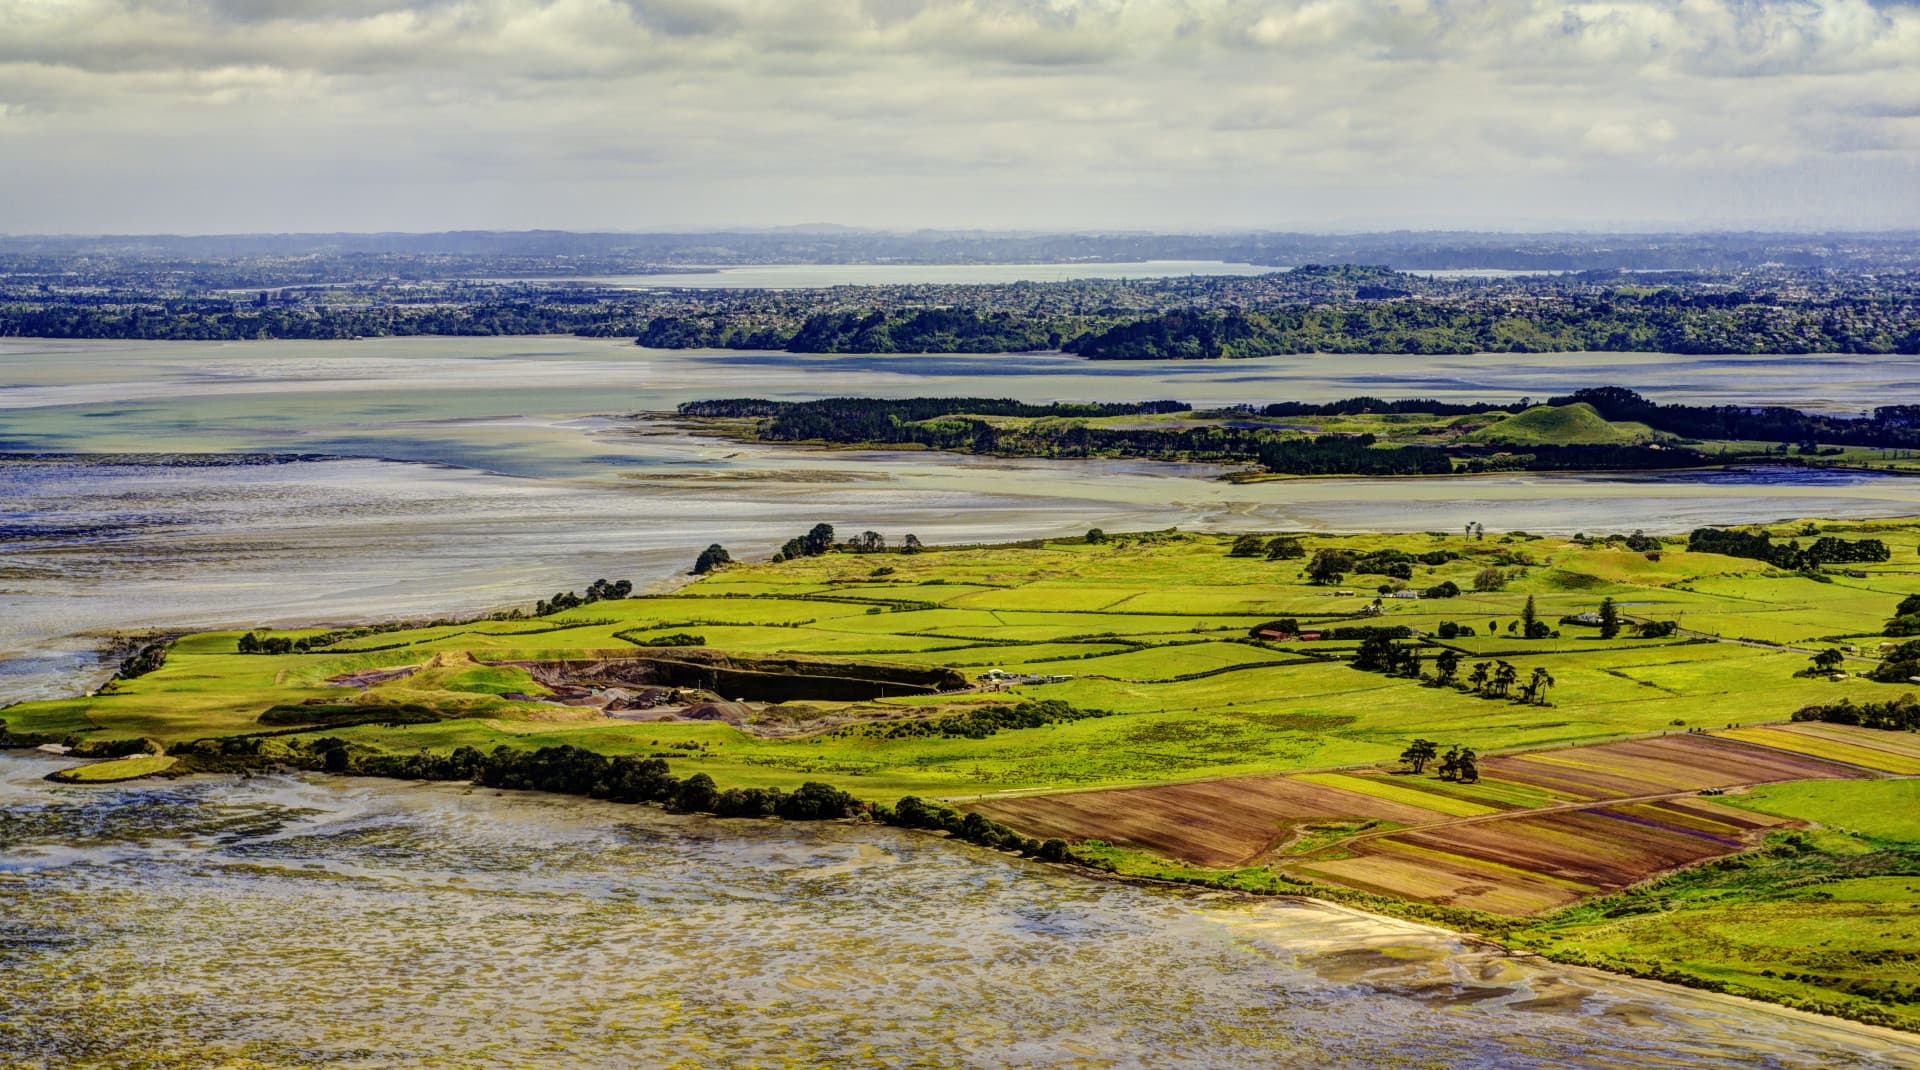
The programme began in 1987 and is still continued and paid for by Auckland Council today. The Manukau is the second largest harbour in Aotearoa New Zealand, with extensive sandflats covering approximately 40% of the area. The programme focuses on the benthic macrofauna of these intertidal sandflats.
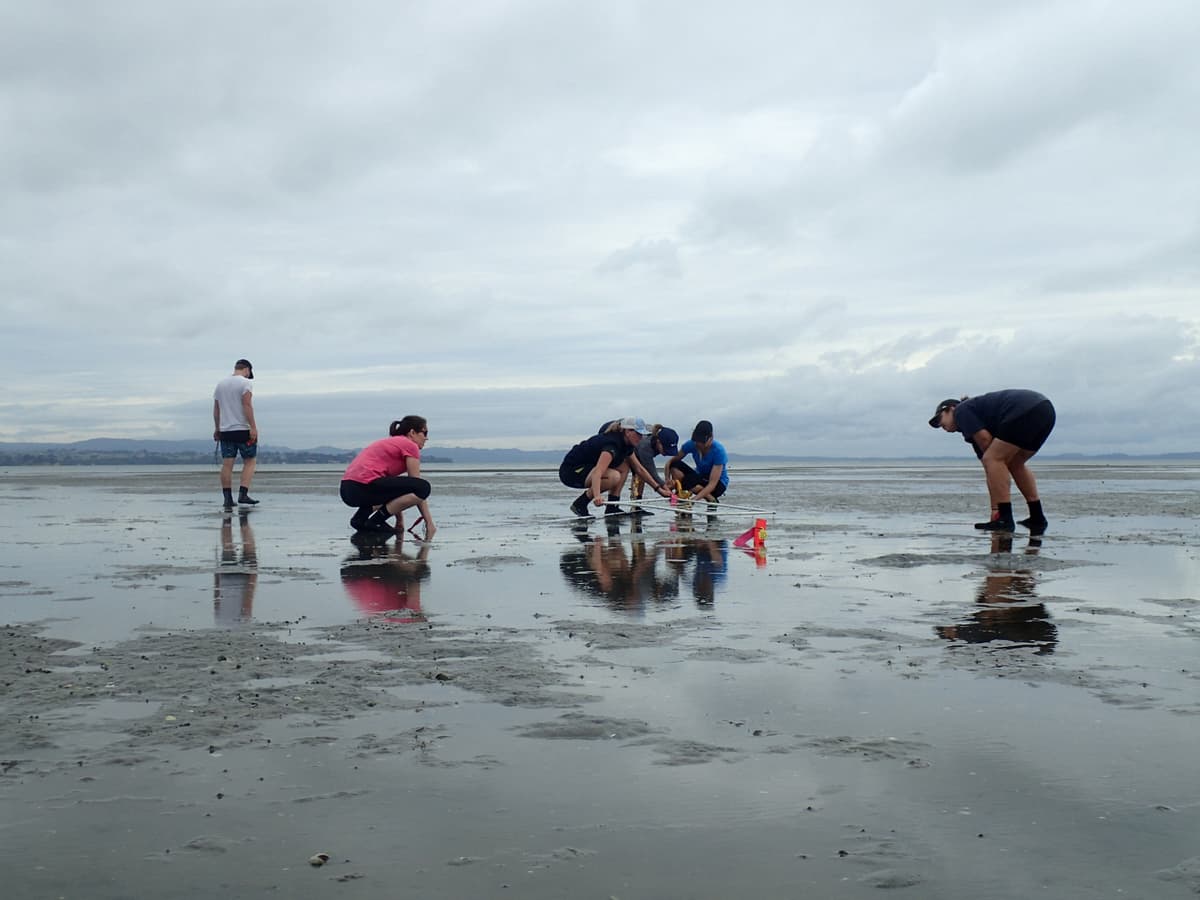
Sampling was initially conducted every 2 months at 6 sites (see map) that represented different areas of the harbour: different land uses, catchments and hydrodynamic compartments. At regular intervals the programme has been assessed for effectiveness and changes have been made to the number of sites, sampling frequency and ancillary variables measured.
The programme has provided useful information on monitoring design and analyses. While the monitoring was primarily of invertebrate abundance data, many of the lessons can also be applied to other data types: sediment and water quality; plant biomass and cover; and abundances and biomass of microphytobenthos and fish.
There is also a strong probability that the lessons learnt from the Manukau data will apply to other regions. This is especially likely for design criteria methods and the appropriateness of analyses. Of particular importance for estuarine monitoring networks is to determine whether the natural variability observed in the Manukau data and supported by other monitoring in the Auckland Region in two different oceans is translatable to other regions in Aotearoa New Zealand.
If long-term continuous time-series could be collected at some selected sites around Aotearoa New Zealand, the data could be used to set contexts for other less frequently monitored sites in a range of locations.
Lesson 1: Principles of design to be decided upon at the start of the programme
- Site size needs to be representative and sample unit size (ie the depth and area) needs to consistently collect small and large species
- Spatial stratification to limit the extent to which spatial variation affects temporal differences
- Species to monitor, based on their known and different responses to important stressors
- Frequency, ie how regularly the estuary will be sampled
- Replication, ie number of samples needed to adequately describe biodiversity and detect change
Lesson 2: Undertake reviews at fixed time intervals to ensure the monitoring programme is cost-effective, yet provides quality, robust data
- Review the programme at fixed time intervals and adapt as necessary
- Cutting sampling replication or frequency affects the ability to detect change
- However, reducing the number of sample sites is effective if remaining sites are continuously monitored
- If long-term continuous time-series could be collected at some selected sites around the country, the data could be used to set contexts for other less frequently monitored sites in a range of locations
Lesson 3: Analyses of long-term data can detect multi-year cyclic trends and patterns that short-term data cannot
- Most species abundances are predictable, even though they show seasonality and multi-year cycles
- Multi-year cyclic patterns cause a problem for short-time series: are the trends you detect going to remain a trend or are you only seeing part of a long multi-year cycle? Temporal patterns and trend analyses from sites that have been monitored for longer time periods can be used to answer this question
- Incorporate temporal variability into analyses, because they are often more sensitive than ones that do not incorporate temporal variability
Lesson 4: Temporal variability can influence the ability to detect tipping points, therefore it is important to consider climate patterns in design and analyses
- Understand the strength and patterns of natural variability. This is useful when predicting risks associated with different activities, including climate change
- Incorporate Southern Oscillation indices (SOI) into analyses either to isolate trends from these patterns or to understand how likely they are to detect any change
- We are more likely to detect tipping points during La Niña, than during El Niño events
Lesson 5: To detect tipping points, sampling more than twice per year is an optimal frequency
- We can detect the arrival of tipping points
- Small management actions can have large consequences
- Small changes can be culturally or ecologically relevant
Lesson 6: Community analyses are much stronger than single-species analyses at detecting small changes
- Sites in areas of high biodiversity will often be more sensitive to change
- The more species exhibiting changes and the more we know about them, the easier it is to assign causality, ie to know which stressors they are responding to
- Small changes accumulate over time and through species interactions, creating large changes in biodiversity and community type
Lesson 7: The length, continuity and consistency of a dataset will determine its ability to detect tipping points
- The longer a dataset, the more use it is for determining effects – but only if it is consistent and some sites are continuously monitored
- Having some sites continuously monitored in your network gives you more ability to detect changes in the other sites you monitor
- Data from one site can be used to provide the context for data collected from another site – or even another harbour
- Knowing whether changes are occurring at one site, in one area, in one or multiple harbours, can determine whether management responses may be necessary
While these lessons are specifically drawn from estuarine monitoring, the majority of them are applicable for any marine monitoring programs. Only the last bullet point of lesson 4 and the specific sampling frequency mentioned in lesson 5 would not apply.


